Super-resolved 3D optical profiling for surface metrology using structured illumination

Lena joined Sensofar in 2018, and since then she obtained a BSc and MSc in Physics and Photonics. She started a scientific career within Sensofar's science team, where she works as Scientific Staff at the R+D department since 2021, working on a variety of research projects, framed within an Industrial Ph.D. Her scientific interests are centered around computational methods for optical metrology, including image processing and optical design.


Super-resolved 3D optical profiling for surface metrology using structured illumination publication
L. Zhukova 1, R. Artigas 1, and G. Carles 1
1 Sensofar-Tech, S.L. (Spain)
https://doi.org/10.1117/12.2621813
Proceedings Volume 12137, Optics and Photonics for Advanced Dimensional Metrology II, 121370F (2022)
Event: SPIE Photonics Europe, 2022, Strasbourg, France
Abstract
The lateral and axial resolution of optical techniques is bounded by diffraction, making the acquisition of surface topographies of samples with nanometric structures impossible. Super-resolution techniques, such as Structured Illumination Microscopy (SIM), have been developed to overcome this limit, enabling an increase in resolution up to a factor of two and allowing to resolve structures too small for conventional optical microscopes.
SIM relies on the projection of structured illumination as periodic fringes with equally spaced phase shifts to recover high-frequency information. A Digital-Micromirror-Device (DMD) can be used to generate structured illumination, providing accurate control and stability of the fringe frequency and phase shifts. Additionally, optical sectioning of the scanned surface is provided, since the projected patterns are only well contrasted within the in-focus regions of the sample. To reconstruct a 3D surface, an optical profiler exploits this optical sectioning capability to localize the maximum signal through the axial scan at each point.
Whilst SIM based on laser interference has been used to super-resolve the axial dimension, this is not possible with a DMD approach. We explore how DMD-based SIM can be used to enhance the profiler’s ability to super-resolve structures within surface metrology. We modify a DMD-based optical profiler to enable lateral super-resolution of the image stack and explore how the quality of the 3D surface reconstruction can be improved. For this, we combine the super-resolved images with different optical sectioning techniques and assess the lateral resolution of the topographic detail via the characterization of the instrument transfer function (ITF).
1. Introduction
The resolution of an optical system is inherently limited by diffraction, due to the wave nature of light. The lateral resolution limit can be defined by the Abbe diffraction limit, which approximates the minimum resolvable distance between two objects as d = 0.5λ/NA, depending on the numerical aperture (NA) of the objective and the wavelength (λ) of the light used. Many applications, including metrology, require going beyond this limit in order to measure smaller structures. In metrology, not only is it important to be able to differentiate laterally between different nanometric objects but also to measure their axial dimension accurately. Measurement is typically achieved by axially scanning the sample whilst computing some focus-sensitive signal, called the axial response of the instrument. In the case of Imaging Confocal Microscopy, the confocal signal determines the axial response, and the resolution (the ability to localize its maximum peak through the scan) is related to the width of the axial response, i.e. the depth-of-field of the microscope, which is also limited by diffraction to d = 2λ/NA2.
Samples with features small enough that challenge these resolution limits are not uncommon. Metalenses are a particular example, as their surface contains a distribution of nanometric features designed to manipulate light. These lenses require accurate topographic characterization but their dimensions are too close to the resolution limit to be resolved by most of the optical acquisition techniques.
The ability to laterally resolve topographic detail can be measured by the Instrument Transfer Function (ITF) of the system, which relates the output measurement with the input height, for a given spatial frequency of the input. Similar to the concept of Modulation Transfer Function for imaging systems, the ITF indicates the attenuation of the measured amplitude height of an input at different spatial frequencies. Lateral resolution can thus be defined as the frequency where the ITF falls to 50% (ISO 25178(600)).[1] Specific samples exist to evaluate the ITF, containing step heights at a defined frequency range and with known amplitudes. Examples of such samples are Siemens star step height and frequency chirp standards, as they contain steps of constant height and varying spatial frequencies.[2]
Increasing the lateral resolution of optical imaging techniques is sometimes referred to as super-resolution in the field. A well-known such technique is structured illumination microscopy (SIM). It stands out for its relatively simple experimental implementation, as most of its difficulty lays in the computer post-processing of acquired data. Besides improving resolution, SIM can also be used to achieve optical sectioning (OS), and therefore as an optical profiling technique. For both applications, SIM is normally implemented by sequentially projecting illumination in the form of sinusoidal fringes with a relative phase change. To differentiate both cases, we will refer here as SR-SIM for super-resolution SIM and OS-SIM for optical sectioning SIM.
Here, we report an implementation of both SR-SIM and OS-SIM using a customization of a commercial optical profiler (S neox, Sensofar, Spain). The system incorporates a digital micromirror device (DMD) that we exploit to project the required illumination for SR-SIM and OS-SIM, as detailed below. We propose and analyze different strategies to combine super-resolution and optical sectioning in order to explore how SIM may be used for super-resolving topographies with spatial-frequency content that would otherwise be beyond the system’s native ITF.
1.1 SR-SIM
The ability of an imaging system to transfer spatial frequencies during an acquisition is characterized by the Optical Transfer Function (OTF). During acquisition, imaging systems act as a low-pass filter, suppressing high spatial frequencies and removing the frequencies laying outside the OTF’s support defined by an optical cut-off frequency, as shown in Figure 1.

The idea behind SR-SIM consists in expanding the OTF support to allow the detection of higher frequencies that compose a sample with improved contrast. This is achieved by exploiting the moiré effect, to make detectable those spatial frequencies that would otherwise be inaccessible, by moving them into the support region of the imaging system.[3] The moiré effect appears when two sinusoidal patterns are superposed, and it can be understood as the appearance of a “beat” pattern, of lower frequency than the patterns that compose it. Similarly, a moiré effect can be observed when a periodic pattern is projected onto a surface containing fine details. In such case frequency mixing occurs; additional high-frequency components are brought into the OTF’s lower spatial frequency range, making them detectable. By accurately knowing the characteristics of the projected illumination pattern, it is possible to unmix the frequencies and recover the information pertaining to the surface. To separate the information, multiple images with different phase shifts of the illumination patterns must be acquired, and each frequency component must be shifted precisely to its correct location to reconstruct a higher-resolution image. The enhancement in resolution is achieved in a direction perpendicular to the pattern direction, thus to cover a larger region of the 2D Fourier space the patterns are projected in several directions, which allows for a more isotropic reconstruction. An illustration of the described process is shown in Figure 2.

1.2 OS-SIM
Optical sectioning is the ability to detect signal from the object’s in-focus plane, whilst rejecting out-of-focus content. This is the basis for optical metrology acquisition techniques such as confocal or focus variation. OS-SIM emulates the confocal signal by projecting an illumination pattern onto the surface sample and imaging the pattern’s contrast through an axial scan, effectively computing the axial response. This enables to reconstruct the 3D topography of the surface, in addition to the focal stack of intensity images.
Two common strategies to implement the patterned illumination are the use of laser interference, and the use of a DMD. The former requires a combination of optical gratings to project sinusoidal fringes onto the sample and a high mechanical control to induce a controlled shift of the fringes, whilst the latter is implemented by re-imaging the DMD plane onto the sample. Uniformly illuminating the DMD plane allows for programmatically setting the illumination pattern, such as fringes. In both cases, optical sectioning can be achieved from a set of three images acquired with projected sinusoidal fringes with 2π/3 relative phase shifts,[4] and the optically-sectioned images can be computed by
(1)
This method to achieve optical sectioning is robust and computationally light, as it only requires applying simple operations to three raw images. Interestingly, the raw data used for the SR-SIM reconstruction algorithm (SIM-RA) can directly be used to achieve optical sectioning through this method, although OS-SIM does not provide the same degree of lateral resolution enhancement as SR-SIM. In the following sections we explore different methods for combining both the optical sectioning capabilities of OS-SIM and the resolution enhancement of SR-SIM.
2. Methodology
2.1 Theoretical background of SR-SIM
The intensity distribution of the structured illumination used in SIM can be represented by a sinusoidal function, described as
(2)
Iθ,ϕ(r) = Io [1 − m cos (2πpθ · r + ϕ)] ,
where r ≡ (x, y) is the spatial position vector, Io is the maximum illumination intensity, m the modulation factor, pθ = (p cos θ, p sin θ) the spatial frequency, with θ being the orientation of the sinusoidal pattern and ϕ is the phase. During imaging, the intensity captured by the camera in the image plane can be defined as
(3)
Dθ,ϕ(r) = [Iθ,ϕ(r)S(r)] ⊗ H(r),
where S(r) represents the surface distribution of the sample and H(k) the optical system’s PSF. With H(k) representing the system’s OTF, the Fourier transform is given by
(4)

Equation (4) shows that the Fourier transform of the captured image corresponds to a linear combination of three different components, shifted and limited by the support of the OTF, centred at the origin, pθ, and -pθ, respectively. If the frequency vector and the phases of the illumination pattern are accurately known, it is possible to recover the information about the surface modulated by the OTF by solving the set of linear equations given by
(5)

One set of equations is solved for each pattern orientation θ. To recover the surface information a simple division by ~H(k) would greatly amplify the noise for the frequencies where the OTF approaches zero. To avoid this problem a parametric Wiener filter is applied instead for each frequency component, which maintains the balance between resolution enhancement and noise suppression as
(6)

where g = −1, 0, 1 represent the three frequency orders. Wiener filters are characterized by a parameter denoted as w1, proportional to the inverse of the signal-to-noise ratio, and its value is normally adjusted empirically.
The separated frequency components all contain information relating to the sample’s structure. There is an overlap in information between components, and they must be shifted to their correct location in the frequency spectrum by making use of the Fourier shift theorem given by
(7)
where F and F−1 denote the Fourier transform and the inverse Fourier transform, respectively. The com-bination of the Fourier spectra yields an enlarged spectrum reach. It is performed by weighted averages, making use of a generalized Wiener filter
(8)

where w2 is another Wiener constant. The final SIM image DSIM(r) is obtained by performing an inverse Fourier transform of ~DSIM(k) multiplied by an apodization function to suppress high-frequency noise outside OTF’s support. The enlarged OTF support directly translates into a resolution enhancement in real space.
The resolution amplification in SIM depends on the structured pattern’s spatial frequency pθ; the closer it is to the cut-off frequency of the OTF, the higher the increment. With an appropriately chosen structured pattern, SIM can provide an enhancement in resolution up to a factor of two, although if the non-linear response of a sample can be exploited the resolution increase can be even higher.
2.2 Combination of SR-SIM and OS-SIM
The SR-SIM reconstruction process outlined in the previous section is not capable of providing optical sectioning, as it includes the out-of-focus content, present in the central ˜S(k)˜H (k) term. This term corresponds to the widefield image, which can also be recovered by adding up the raw images modulated by the sinusoidal illumination. The addition of the 2π/3 shifted sinusoids removes the modulation pattern, resulting in a term with resolution limited by the optical cut-off. Moreover, the full extended bandwidth can be recovered from the side frequency components ˜S (k ± pθ), as there is overlap between them, making the ˜S (k) component redundant. Interestingly, the side frequency components contain all spatial frequencies of the sample but not the out-of-focus content, which is only present in the central frequency component. Therefore, simply excluding the central component provides a method to achieve optical sectioning, which was proposed by Dan et al.,[5] referred to as integrated SIM (iSIM).
An alternative method for combining super-resolution and optical sectioning is to computationally at-tenuate the low spatial-frequency range of the central frequency component, by high-pass filtering using for example an inverted Gaussian function in the Fourier domain. Results following this approach will be referred to as OTF-attenuation SIM (oaSIM). Because only very low frequencies are suppressed, filtering all three frequency components (and not just the central component) provides similar results.
2.3 SR-SIM reconstruction algorithm
The reconstruction algorithm used in this research follows the basis of the algorithm presented by Lal et al.[6] with some adjustments to fit our experimental setup. A summary of the main steps performed by the algorithm is shown in Figure 3.

A sinusoidal pattern is projected onto the sample, with three equally spaced phase shifts and oriented in two perpendicular directions, resulting in a total of six raw images. The acquired raw images contain the three components mixed together; the aim is to separate them, shift them to the correct location in frequency space, and combine them to a single output with higher bandwidth. The required shift corresponds to the frequency of the projected illumination, and errors in the determination of this shift may lead to errors and artefacts in the final image. The components overlap and a wrong frequency shift would result in a frequency-space misregistration of the components before merging, yielding artefacts in the reconstructed super-resolved image. Although in our case it is possible to calculate these parameters from a priori knowledge of the DMD mirror pitch and microscope magnification, we calculated the frequency shift from the raw data by identifying and localising the peaks in the Fourier domain, through a centre of the mass algorithm, which evaluates a region near the peaks in the Fourier representation to sub-pixel precision.
Because we used a DMD and the illumination shift is performed programmatically by shifting the pattern by one micromirror, the relative phase between images is fixed and very precise. However, it is crucial to correctly determine the global phase, which is the absolute position of the projected illumination within the images. To determine the phase we employed a method proposed by Shroff et al.,[7] in which the phase is estimated from the peaks given by the pattern frequency in Fourier space. The method becomes less reliable if the pattern frequency is close to the optical cut-off because there would be a lower signal-to-noise ratio. This is not a problem in our case, as the pattern frequency corresponds to 71% of the cut-off.
Once the pattern parameters have been estimated, the raw images are transformed to the Fourier space and the different component mixed into the OTF support are separated. Each component is first Wiener filtered to increase the contribution of higher frequencies without increasing the noise and then it is moved to its correct location in Fourier space. The components are then merged through a generalized Wiener filter and multiplied by an apodization function to suppress high-frequency noise outside OTF’s support. The final reconstruction is then inverse Fourier transformed to obtain a high-resolution image.
The conventional SIM algorithm consists of a reconstruction of single 2D planes in which the lateral resolution is enhanced. When applied to a stack of planes acquired along the optical axis, each plane will be reconstructed separately. Nevertheless, this set of reconstructions will not have optically sectioned information. As shows Equation (8), the conventional reconstruction contains out of focus information. To achieve optical sectioning, the algorithm needs to be modified, for example using iSIM and oaSIM mentioned above.
Besides iSIM and oaSIM, we also considered two alternative reconstruction strategies. These are based on calculating OS-SIM using Equation (1), and merging with the SR-SIM image stack. The first method is a simple plane-wise multiplication of the two stacks, leading to a combined super-resolved and optically-sectioned stack, that can therefore be used to reconstruct the output topography. This method will be referred to as multiplication SIM (mSIM).
Secondly, we used a modification of a technique called HiLo, which combines OS and brightfield information in the Fourier domain. In HiLo, a low-pass filter is applied to the OS image and is combined with a high-pass filtered brightfield image.8 We replace the brightfield image by a SR-SIM image so that the higher spatial frequencies of SR-SIM can be transferred to the optically-sectioned image stack, thus the lateral resolution improvement is maintained and merged with the sectioned information from the OS image stack. A schematic summary of all the reconstruction types that are considered here and their combination process is shown in Figure 4.
For reference, we compare below the performance of these approaches against a baseline method that is implemented in the commercial system (S neox, Sensofar, Spain). The baseline method employs the OS-SIM approach described above, but with coarser projected fringes, and will be referred to as Optical Sectioned Coarse Shift Single Sampling (OS-CSSS).
2.4 DMD projection
Sensofar’s S neox 3D profiler was used to acquire all the experimental data, illuminating with an LED with a central wavelenegth of 0.46 µm and observing with a 150×0.9NA objective. The system uses LED

illumination and a digital micromirror device (DMD) placed at a sample’s conjugate plane. The DMD consists of a diamond mirror array, where each mirror is switchable and has two stable positions at −12°and 12° (also called ON and OFF states) which allows to steer the light and create illumination patterns. Due to the diamond mirror array arrangement, the structured patterns were projected in two directions perpendicular one to another, oriented diagonally with respect to the camera at: θ1 = 45° and θ2 = 135°. For SR-SIM, fringe patterns consisting in a micromirror configuration of one mirror on, two off, were used. This is the highest frequency projection pattern that still allows a relative phase shift of 2π/3. The pitch of each mirror is 7.64 µm, which projected onto the sample the period of the sinusoidal pattern becomes 0.36 µm corresponding to a frequency of f1 = 2.78 µm-1. In contrast, the default OS-CSSS algorithm implemented in the commercial profiler implements six-mirror wide fringes (three mirrors on and three off per fringe), which corresponds to a projected frequency of f2 = 1.39 µm−1. For OS-CSSS, the pattern is projected in only one direction, at 135◦, which has some implications as we show below.
Example images of the projected illumination patterns for OS-CSSS and OS-SIM are shown in Figure 5, projected on a flat mirror. As can be observed, the frequencies differ significantly, and the higher-frequency OS-SIM fringes are significantly less contrasted due to being suppressed by the imaging system.

3. Results
3.1 Stack image
Initially, we assessed the resolution increase on the stack image, which is the extended depth-of-field optical image of the sample constructed by merging all images of the scanning into a single image by combining the in-focus components. To do this, the axial response is calculated for each pixel using the intensity value of the optically-sectioned image through the axial scan.
The plane where each pixel has the maximum value of the axial response (maximum intensity of the optically-sectioned image stack) was saved into a z-map. Finally, a single stack image was constructed by assigning at each pixel the intensity value of the image corresponding to the plane of the z-map. This process was repeated using OS-SIM as both the axial response and image stack, and also using OS-SIM as the axial response but the SR-SIM as the image stack, which allowed to reconstruct a super-resolved image stack.

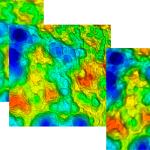
Examples of super-resolved image stack are shown in Figure 6. In this case, the samples were tilted so that only a small region was in focus at each plane during the axial scan, and yet the stack image is composed from all in-focus components. The two examples shown, demonstrate an evident increase in resolution through SIM-RA. In the first example, the OS-SIM stack image is noisier and the circular structures are hard to differentiate between them. The stack image achieved through SIM-RA shows the structures with higher contrast; the hole-like structures appear sharper and they can be more easily distinguished from one another. The higher contrast at relatively high frequencies is evident in the second example.
3.2 Optical Sectioning
The different methods to achieve super-resolved areal measurements were evaluated and compared, with a view on their ability to combine the super-resolved optical image and the optically sectioned information into a super-resolved topography. The sample used in this section was a diffraction grating of a period of 3600 grooves/mm, with a sinusoidal cross-section. To validate the measurements, the average groove depth was measured using an atomic force microscope (Nanosurf, Switzerland), resulting in average depth values of approximately 60 nm.
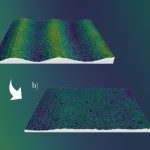
The spatial frequency of this sample is 3.6 µm−1, below but close to the optical cut-off, and so the amplitude is greatly attenuated by the OTF. The default algorithm of the commercial system, OS-CSSS, is not capable of resolving such frequency. On the other hand, SIM-RA can resolve the grooves of the sample. To simultaneously show super-resolution and optical sectioning, we tilted the sample with respect to the optical axis, so that an axial scan combined with optical sectioning would be required to reconstruct the topography. Figure 7 shows the central plane of the stack of images corresponding to the iSIM reconstruction, where the brightest signal represents the in-focus region, and dark areas correspond to the out-of-focus region.
The sample was scanned through the optical axis for N planes, resulting in 6N raw images. After pro-cessing with the SIM-RA, N images were obtained per reconstruction type. A series of profiles corresponding to a cross-section of a gray level image from each reconstructed stack is shown in Figure 8.


Compared to the OS-SIM profile, all reconstructions benefit from SIM-RA and show an improvement in lateral resolution, as the sinusoidal profile displays more clearly the grooves, whereas for OS-SIM they have a clearly lower amplitude and signal-to-noise. Among the different reconstructions, it is clear that conventional SR-SIM does not achieve optical sectioning, which is expected as it does not differentiate the in focus regions from the out of focus regions. Similar degrees of optical sectioning are achieved by iSIM and oaSIM and are comparable to the OS-SIM measurement, with oaSIM showing slightly higher amplitudes for the in focus region. OS capabilities are also shown in the mSIM reconstruction, albeit with a lower degree of differentiation between in focus and out of focus regions. Finally, HiLo achieves a degree of OS that is the most similar to the OS-SIM acquisition, as was expected, with a greater lateral resolution improvement in the region of the sample that was in focus.
When analysing the topographic heights of each reconstruction, it was seen that the heights appear very different from the nominal value measured by the atomic force microscope. The OS-SIM measurement was approximately 40 µm, higher than the OS-CSSS measurement but still below the nominal value. In contrast, the other reconstructions showed increased heights, up to double the nominal value. This large difference in acquired heights could be attributed to the fact that SIM-RA contains user-defined constants, particularly the Wiener parameters, which must be adjusted empirically. These parameters adjust the weights given to each frequency component, and the side lobes containing higher frequency components can be given larger weights, affecting the resulting amplitudes. The recorded depths therefore seem to depend greatly on how these parameters are defined, which makes it difficult to calibrate for accurate measurements.
This sensitivity is not found in the case of HiLo. The HiLo method uses the optical sectioning information from the OS-SIM data, which does not depend on any user-defined parameters, while the super-resolution information comes from the SR-SIM image stack, which does. As a quick experiment, we used two sets of Wiener parameters, and observed the differences in the reconstructions for the different methods. While methods based on super-resolution, such as iSIM and oaSIM, showed differences of up to 50% in the depth measurements, results for HiLo maintained a constant depth value of around 90 nm, with a reduced sensitivity to these parameters, which is attributed to the fact that the optical sectioning is based in OS-SIM.
3.3 ITF assessment
3.3.1 RS-N standard
An approximation to an ITF can be done by evaluating the depth of a sample of varying spatial frequency. One such sample is the RS-N standard (SiMETRICS GmbH, Germany). It consists of nine regular gratings of periods ranging from 0.3 µm to 5 µm. The gratings are manufactured by dry-etched up to variable nominal depths, producing nearly vertical edges. Table 1 shows the nominal depths of each grating measured by the Physikalisch-Technische Bundesanstalt (PTB, Germany), which will be used as a reference in this work.[9]

This sample contains enough lateral spatial frequencies to evaluate the transmission behavior of the imaging sensor and the reconstruction algorithm.
Another effect should be taken into account in assessing height measurement using square waves of high frequencies. A square wave can be decomposed into a series of odd-integer harmonics in the form of sinusoids of increasing frequency
(9)

where 2L is the period of the wave and, given the limited pass-band of the optical system, not all frequencies can be transmitted, and some are highly attenuated. In practice, this results in a distorted and smoothed shape that can have different amplitude. For example, for both the 0.3 µm and the 0.4 µm grating periods only the fundamental harmonic can be transmitted, suggesting that the measured amplitude would be a factor 4/π higher than the actual step.
Methods that rely on fringe-based structured illumination to be projected onto the sample are prone to having a dependency on the orientation, given that there is a preferred direction of projection. This is why when very regular and periodic samples are used, these differences in behaviour might be most noticeable. As an example, two profiles from measurements of the RS-N sample of 3 µm of period are shown in Figure 9. These profiles were acquired using the OS-CSSS confocal algorithm, part of a commercial product. One was

acquired with the sample grooves placed at 45° with respect to the projected pattern and the other with the sample perfectly aligned with the pattern.
The first case shows a profile shape that is expected, with well-defined plateaus. The second case, in contrast, shows a deformed profile where many points appear as non-measured. This suggests that crossing the features of the sample with respect to the illumination is preferred, which is reasonable. Nevertheless, this defeats the purpose of SR-SIM, which extends the OTF support beyond the diffraction limit precisely in the direction of the projected patterns. In our case, because of the pixelated nature of the DMD, we are able to extend the OTF support in two directions, resulting in a four-leaf clover shape. This means that the extension is not isotropic. As a balance, we have made measurements orienting the sample at a 165°, which aligns the samples features in Fourier space at an angle of 30° with respect to the projected fringes.
To compare the different reconstruction algorithms, we computed the ITF sampled at the frequencies available from the RS-N sample. Results are shown in Figure 10. Calculation of the measured depth was performed following the same process for all reconstructions. The process consisted in a pre-processing of the data to level and align them. Then, as per Equation (9), each dataset was filtered up to the first harmonic, to simulate the effects taking place for higher frequency samples where the OTF cut-off allows only for one frequency to pass. Finally, we calculated a histogram of the topography, localised the two dominant peaks, and calculated the depth difference, correcting by a factor of 4/π .
Results in Figure 10 are all compared with the nominal values of the step heights (see Table 1) and with the processed results using the default OS-CSSS algorithm of the commercial system. All reconstructions show depths closer to the nominal values and an improvement in resolution with respect to the OS-CSSS measurements. This can be seen in the increased cut-off, as the higher frequency components no longer decay to zero.
All the reconstructions employing SIM-RA show a similar behaviour at the low-frequency range of the graph, obtaining depths similar to the nominal for all reconstructions except for oaSIM, which shows values that are closer to the OS-CSSS results. The HiLo reconstruction shows the best accordance with respect to the nominal values for the lower frequency range. As the frequency is increased, a systematic dip appears in all the ITFs corresponding to the grating of spatial frequency 1.2 µm−1. Finally, all reconstructions show improved sample heights for the two gratings composed of spatial frequencies that were too high to be resolved with the OS-CSSS acquisition method.

3.3.2 Circular chirp evaluation
A conventional chirp standard consists of a continuous set of steps of increasing frequency. In this section we analyse a circular chirp standard with the spatial frequencies increasing towards the centre, which allows for a characterization of the ITF in 2D[10] for different angular directions without the need for rotating the sample, and facilitates the identification of angle dependent anomalies.
The measurement of the chirp standard using OS-CSSS is shown in Figure 11. Results confirm the dependence of the measurement method on the illumination fringe direction for a particular frequency range, as was suggested in the previous section, given that for the OS-CSSS case only one direction is used for projection.
The top profile shown in Figure 11 was evaluated at 45° and the bottom profile at 135°. An obvious discrepancy can be seen in the amplitudes of the higher spatial frequencies, where one profile shows an increase in modulation over four times the nominal value, as well as a difference in the highest resolvable spatial frequency. The differences come from the fact that the bottom profile is evaluated at points where the features of the sample are perpendicular to the projected illumination, while in the top profile they are parallel or nearly parallel. This close alignment of the illumination grating and the sample’s features creates moir´e effects which seem to improve the lateral resolution albeit distorting the apparent depth value. In the direction where no moire´ appears, in contrast, the depths appear to be correctly recorded but the lateral resolution is worsened.

The region where the heights are amplified visually stand out from the average plane of the sample. The amplified regions always appear in the same range, equivalent to spatial frequencies close to the frequency of the projected patterns. Spatial frequencies close to the amplified ones show an attenuation in the step height value, resulting in measurements showing lower values than the nominal. This further implies that these effects are related to moire´ effects, as the spatial frequencies similar to the projection frequency seem to highly interfere, resulting in incorrect depths.
For the sake of comparison, the sample was measured with different interferometric techniques, also available in the commercial optical profiler. As expected, no artefacts were present, and the surface of the sample appeared uniform, because interferometric measurements do not rely on the projection of structured light in the form of periodic patterns.
Given that the circular chirp standard is composed of varying spatial frequencies, an ITF could be directly obtained from a Fourier transform of a profile, which would allow to find the lateral resolution at the frequency where the ITF falls to 50%. The overshoots and the amplitude variations of the profiles obtained in our measurements did not allow for this direct evaluation. Nevertheless, a visual comparison does show resolution

improvement between SIM reconstructions and OS-CSSS measurements. After applying SIM reconstruction methods to another circular chirp standard, composed of higher spatial frequencies corresponding to spatial wavelengths in a range of 0.1 µm to 5 µm, the resolution limit went from approximately 380 nm for OS-CSSS to 280 nm for SIM reconstructions. A comparison is shown in Figure 12, where an OS-CSSS measurement is shown against a SIM reconstruction, in this case using HiLo. It can be observed how the HiLo reconstruction is capable of laterally resolving smaller structures at spatial frequency ranges where OS-CSSS is not capable and only retrieves noise. In terms of axial resolution, the measured depths of each reconstruction were not accurate, similar to what happened when the commercially-available OS-CSSS measurement mode was used. The nominal depth of the sample is 32 nm while values up to 70 nm and 200 nm were recorded using OS-SIM and SR-SIM reconstructions.
For both the RS-N and circular chirp samples, it can be observed how for frequencies close to the illumination frequency inaccurate depth measurements are obtained, with either attenuation or amplification of the depth amplitudes. This was observed both for OS-CSSS and all SIM reconstructions, with illumination frequencies of 1.39 µm−1 and 2.78 µm−1, respectively. For instance, for both the chirp and the RS-N sample attenuations appear around the 800 nm mark, corresponding to a frequency of 1.25 µm−1 which is close to a multiple of the projected frequency. On the other hand, there is amplification for 600 nm, with a frequency of 1.66 µm−1, a multiple of which is slightly higher than the projected frequency.
4. Conclusions
We have reported an implementation of optical super-resolution on a commercial optical profiler. The implementation is based on SIM microscopy and exploits the use of a DMD to project structured illumination. Conveniently, the illumination patterns that are required for super-resolution, can also be employed to implement the optical sectioning used for reconstructing the surface topography. Experimental results of the super-resolution technique showed a clear increase in the spatial-frequency that can be imaged, therefore allowing to resolve smaller structures than conventionally possible. Additionally, we explored how the optical sectioning and the super-resolution capabilities can be combined in order to increase the lateral resolution of the reconstructed topographies. For this, we compared a number of reconstruction and combination approaches. Despite some differences, we observed an increase in the lateral resolution in all cases, albeit with the appearance of artifacts in the reconstructed topographies, that prevent from extracting reliable depth measurements. Results have also shown how this artifacts appear for spatial frequencies close to the frequency of the projected illumination fringes, and that there is a dependence on the sample’s orientation with respect to the orientation of the illumination. Suppressing such artifacts and increasing the robustness of the method is the subject of future work.
Acknowledgments
We want to express our gratitude to Ceramic Data Solutions and the PTB for providing the samples used in this research project.
References
[1] Giusca, C. and Leach, R., “Calibration of the scales of areal surface topography measuring instruments: Part 3. resolution,” Measurement Science and Technology 24, 105010 (09 2013).
[2] Seewig, J., Eifler, M., and Wiora, G., “Unambiguous evaluation of a chirp measurement standard,” Surface Topography: Metrology and Properties 2, 045003 (11 2014).
[3] Gustafsson, M. G. L., “Surpassing the lateral resolution limit by a factor of two using structured illumination microscopy,” Journal of Microscopy 198(2), 82–87 (2000). https://onlinelibrary.wiley.com/doi/pdfdirect/10.1046/j.1365-2818.2000.00710.x.
[4] Neil, M. A. A., Juˇskaitis, R., and Wilson, T., “Method of obtaining optical sectioning by using structured light in a conventional microscope,” Opt. Lett. 22, 1905–1907 (Dec 1997).
[5] Dan, D., Yao, B., and Lei, M., “Structured illumination microscopy for super-resolution and optical sectioning,” Chinese Science Bulletin 59, 1291–1307 (04 2014).
[6] Lal, A., Shan, C., and Xi, P., “Structured illumination microscopy image reconstruction algorithm,” IEEE Journal of Selected Topics in Quantum Electronics 22, 1–1 (07 2016).
[7] Shroff, S. A., Fienup, J. R., and Williams, D. R., “Phase-shift estimation in sinusoidally illuminated images for lateral superresolution,” J. Opt. Soc. Am. A 26, 413–424 (Feb 2009).
[8] Martinez, P., Bermudez, C., Carles, G., Cadevall, C., Matilla, A., Marine, J., and Artigas, R., “Metrological characterization of different methods for recovering the optically sectioned image by means of structured light,” 24 (06 2021).
[9] Niehues, J. G., Experimentelle Untersuchung des Optimierungspotenzials in der kurzkoh¨arenten Inter-ferenzmikroskopie, PhD thesis, Kassel, Universit¨at Kassel, Fachbereich Elektrotechnik/Informatik (03 2016).
[10] Dai, G., Jiao, Z., Xiang, L., Seeger, B., Weimann, T., Xie, W., and Tutsch, R., “A novel material measure for characterizing two-dimensional instrument transfer functions of areal surface topography measuring instruments,” Surface Topography Metrology and Properties 8, 045025 (11 2020).